

Alert Report Summary
Accessing the Report Summary
When you click on the “Status” category in the Alert Listing, you will get a pop-up window with the Report Summary.
Content
The summary has two main tabs:
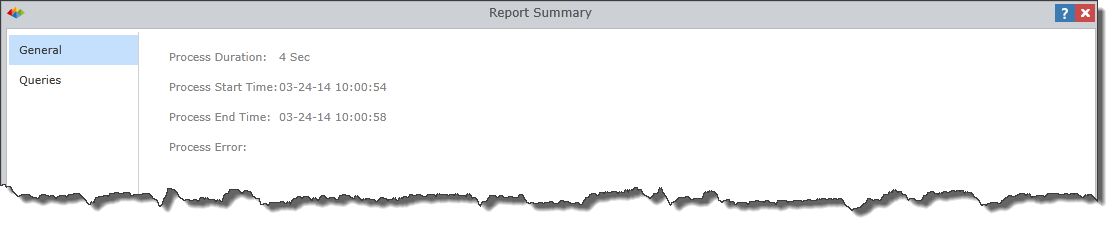
General
Process Duration – you can view the time it took for the alert to be run.
Process Start Time – this is when the execution of the alert began.
Process End Time – this is when the execution of the alert ended.
Process Error – you can view the description of any errors.
Queries
You can view information about all the queries that were involved in the alert. This is helpful for resolving performance issues and MDX query errors.
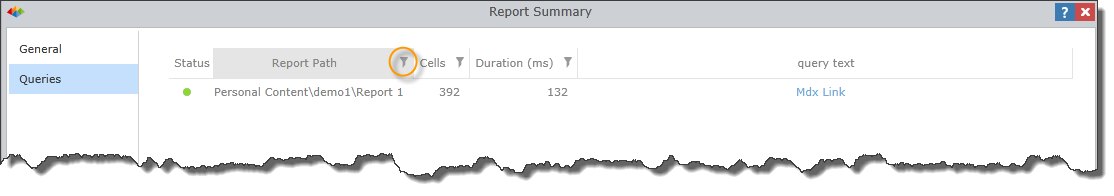
NOTE: The filter icon (as outlined in yellow) is present in many of these options to provide you the ability to filter the categories to easily view the desired items.
Status – the color of the light will indicate the status of each query item in the template.
| Color | Status |
|---|---|
| Blue | Unprocessed |
| Green |
Successful execution |
| Yellow | In process |
|
Orange |
Partially successful execution |
| Red |
Execution errors or empty results on all queries |
Report Path – view the Data Discovery source of the query.
Cells – this is the size of the query. You can view how many data cells there were in the resulting query.
Duration – view how long the alert took to run per query.
Query Text – access a link to the MDX that was run for the query.
Query count – view the amount of queries that were executed in the alert.
Home |
Table of Contents |
Index |
User Community
Pyramid Analytics © 2011-2022